PCA VaR
PCA - Principle Components Analysis
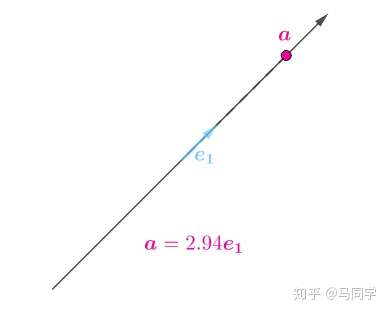
Suppose we have a point $a = (x,y)$, it represents the linear combination under Orthonormal basis $e_1$, $e_2$.
\[a = \left[\begin{matrix} x\\y \end{matrix}\right] = xe_1 + ye_2\]If we change the basis, then $x$ and $y$ will change correspondingly. As the picture below:

As shown in picture, even through the $e1$, $e2$ changes but the origin doesn’t change. As a result, the distance between $a$ and the origin doesn’t change.
\[|a| = x^2 + y^2\]So there is a balance in x and y, if x increases then y should decrease, vice versa.
Above conclusions can be extended to higher dimensions.
So we are trying to find optimal $e1$,$e2$ to represent our data. What’s the optimal?
If we want to just use less dimensions to represent our point which means we maximize $x$ and minimize $y$. Take $a$ for example, below is the optimal $e_1$,$e_2$.
As you can see, using $e_1$ can fully represent $a$ without loss information. However, in most cases, we have more than just one point and we want to find a optimal basis for a bunch of points.
Suppose we have a matrix $Z$.
\[Z = \left[\begin{matrix} x_1 & x_2& ... &x_m\\y_1 & y_2& ... &y_m\\:&:&...&:\\z_1 & z_2& ... &z_m\end{matrix}\right]\]Each column represents a point’s coordinate under basis.
Then we are going find a basis that maximize $x_1^2 + x_2^2 + … + x_m^2$, then maximize $y_1^2 + y_2^2 + … + y_m^2$ and keep going.
Such $e1$ is the most important component, $e2$ is second important …
Link PCA to Finance - PCA VaR
A PCA (Principal Component Analysis) is implemented to decide how many significant factors that afect the equity market. Given N stocks, a PCA could extract only a handful (say 3-5) of factors (decided by the eigenvalues of the PCA). These are known as common factors. One can think of these common factors as macroeconomic variables such as in ation, GDP, exchange rates, etc.
However, the main drawback of PCA is we don’t know the interpretations for the factors extracted from PCA.
Suppose we have N stocks and M observations for each stock, their returns can be represented by $R_{m*n}$. Each column represent a stock return.
Then we conduct PCA on this return matrix to get a bunch of eigenvectors, denote as $B_{n*n}$.
Denote factor matrix as $F_{m*n}$, each column represents a factor, then:
\[F_{m*n} * B_{n*n} = R_{m*n}\]Note: $B_{n*n}$ is Orthogonal Matrix, since they were orthogonal basis actually. So $B^T = B^{-1}$.
We can calculate our factor matrix as below:
\[F_{m*n} = R_{m*n} * B_{n*n}^{-1}\]To understand this in linear algebra, each column in $B_{n*n}$ is a base vector $e$.
Each row in $F_{m * n}$ was like the coordinate.
One coordinate times all the eigenvector we can get one sample (a row in $R_{m*n}$).
However, to do PCA VaR, we need to under stand this equation in stock-wise perspective. Each column in $F_{m*n}$ is a factor time seires and each column in $B$ was like the coffecients for stock return regression.
\[R_{i,j} = B_{1,j}F_{i,1} + B_{2,j}F_{i,2} + ... + B_{n,j}F_{i,n} \\ = \left[\begin{matrix} F_{i,1} & F_{i,2} & ... & F_{i,n}\end{matrix}\right] * \left[\begin{matrix} B_{1,j} \\ B_{2,j} \\ ... \\ B_{n,j}\end{matrix}\right]\]$R_{i,j}$ means the i th day return. The first row vector $F_i$ is the factor values for i th day and it contains n factors. The second vector $B_j$ is the coefficients for j th stock.
Right now, we have time series of factors. Then we can calculate the factors’ variance-covariance matrix and times their betas to calculate stock variance. $\Omega_{factors}$ is factor cov matrix and $\Omega_p$ is stocks cov matrix just like the one we estimated from stock returns.
\[\Omega_p = B * \Omega_{factors}*B^T\]Once we get $\Omega_p$, we can apply weights to calcualte the variance of our portfolio then using the way as parametric VaR to calculate Value at Risk. $a$ is significant level.
\[VaR = N^{-1}(a)*\sqrt{w^T\Omega_pw}\]For new coming stocks or portfolio, we can run regression on factors using stock return.
Coding
Coding Logic:
- Decomposing universe stock return to get factors
- Calculate factor cov matrix
- Run regression to get beta matrix
- Portfolio Variance
- Calculate PCA VaR
BackTest
Using 0.05 as significant level, PCA-3 means using 3 factors and PCA-5 means using 5 factors. Using portfolio return as approximation.

Each stocks in portfolio run regression on factors.

References
Global Risk Management - Ren-Raw Chen
如何通俗易懂地讲解什么是 PCA 主成分分析